

We currently have a lifetime deal for IMGHaste, a tool to increase your website speed by instantly optimizing all your images and setting up a white-label CDN.
I bet you have used at least one of these tools to measure your website performance:
They all do fine – they give you a score and suggestions on where to optimize your website.
But have you noticed that the AVG speed they provide you is never the same?
The reason is that most of these tools simulate traffic on your website to test your speed.
They will simulate a session and will measure your website speed based on that sample session.
But there’s a caveat.
Page load times don’t work the same for all users.
It can vary due to connectivity and the internet speed of each user, the browser they’re using to navigate, and even the country from where they’re visiting your website.
These tools also give you a single average metric, but it turns out that every page on your site is different—and so is its load time.
Fortunately, there’s a free turnaround – Google Analytics.
Measuring your website performance with Google Analytics
Google Analytics measures your website speed performance actual user data, instead of a simulation.
However, it won’t speed up insights on the total traffic but a 1% sample it takes to track site speed metrics.
You can see your website sample size by using our free website speed Google Data Studio report template, just as shown below:
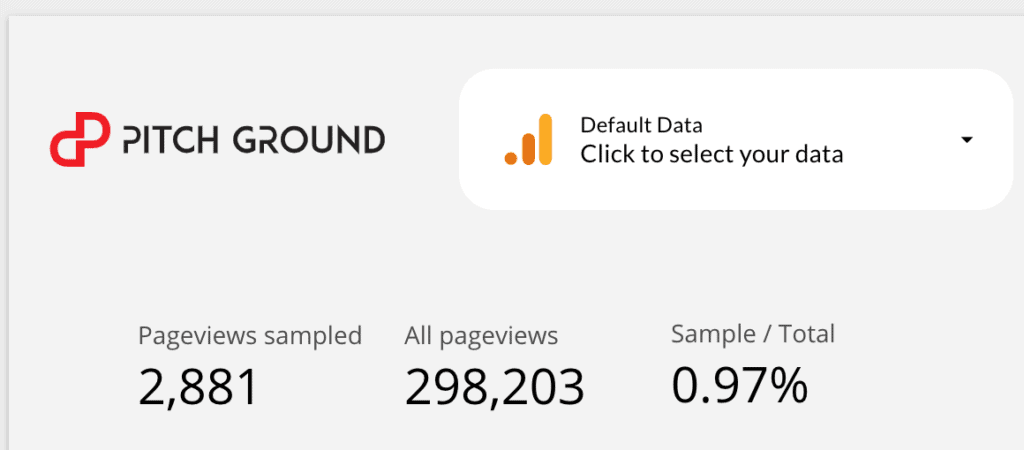
As you can see, Google Analytics has a metric of the number of page views they’re taking to measure website speed performance, and, in this case, it’s below 1%.
Such 1% is still better than a single simulated session because 1) Google Analytics gives you more speed-related metrics, and 2) you can break down such data into important factors or dimensions.
I will show you what I’m talking about by navigating our report template.
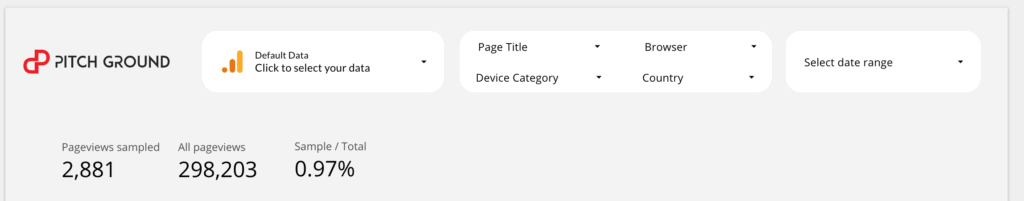
With Google Analytics, you can track your historical performance, which tools like speed Insights don’t provide.
And you can also filter and break down your speed metrics into pages, browsers, devices, and countries so you can spot more specific improvement opportunities.
We also include some beautiful visualizations to let you see your site performance by each of these dimensions. For instance, you can notice that the longest AVG page load time is in Kenya, tablets, Android, and some hidden pages.
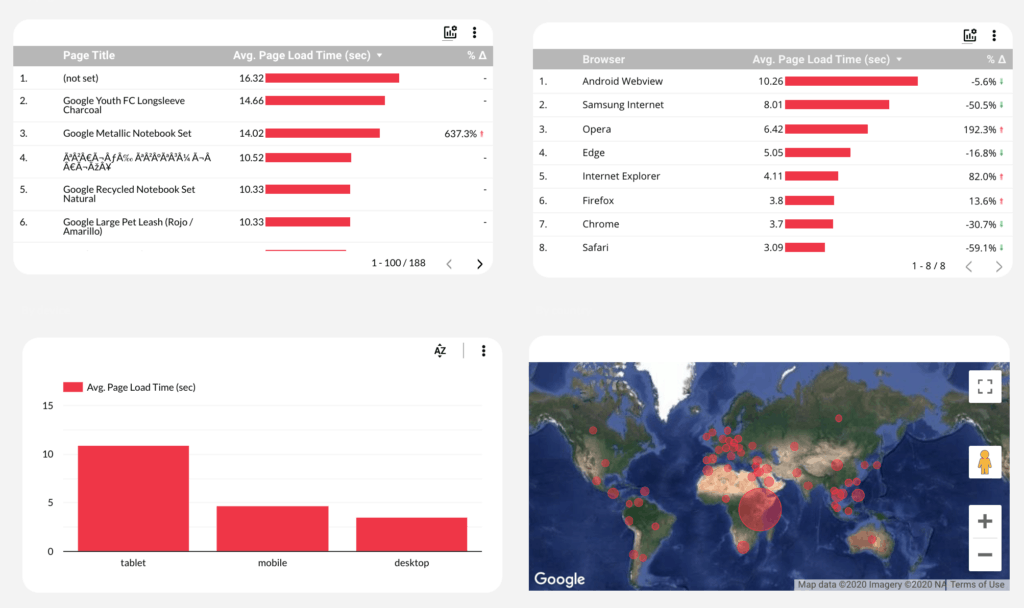
None of the most common tools give you this kind of insight with historical data and this level of granularity. And you only need to create a copy of our free template!
Now it’s time to dig into metrics.
Avg. page load time
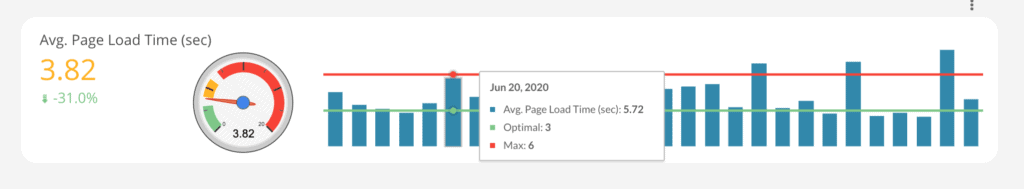
Avg. page load time is the general speed metric that encompasses all the other metrics. It gives you an idea of how many seconds does a page takes to load fully. As a reference, fast site loads in less than 3 seconds; after 6 seconds, according to Google, your conversions and UX may be highly impacted.
In fact, Google has several studies where they show that.

Avg. Page Download time
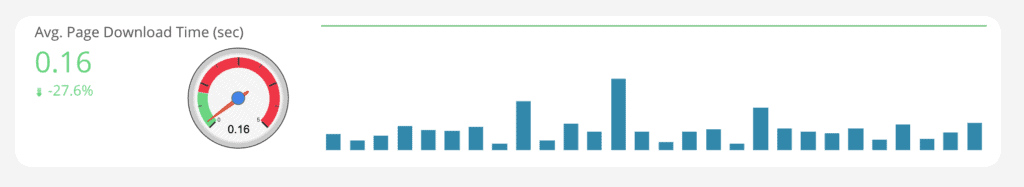
This metric measures the total seconds a page takes to load its DOM (i.e., Document Object Model) or the HTML.
It is not counting yet elements like CSS stylesheets and images that load after the HTML is obtained. It doesn’t consider the compound time of the other aspects that should load before this point, which Avg. Document Content Loaded Time does. It’s an isolated metric.
The optimal Avg. Page Download Time shouldn’t be longer than one second.
Avg. Document Content Loaded Time
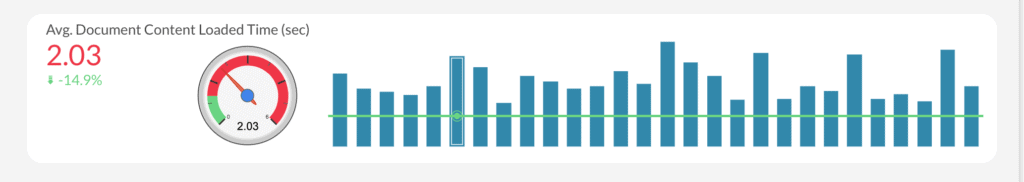
Unlike Page Download time, this metric considers all the time a page takes to fully load from a user clicks a link until the DOM is ready. The optimal Avg. Document Content Loaded Time shouldn’t be above one second.
Avg. Document Interactive Time (sec)
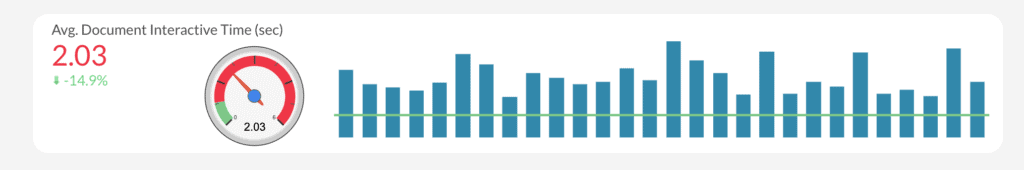
This metric represents the time a page takes from a user clicks a link and the page loads content a user can interact with, even though the DOM hasn’t fully loaded. The optimal Document Interactive Time shouldn’t be above 0.8 seconds.
Avg. Server Response Time
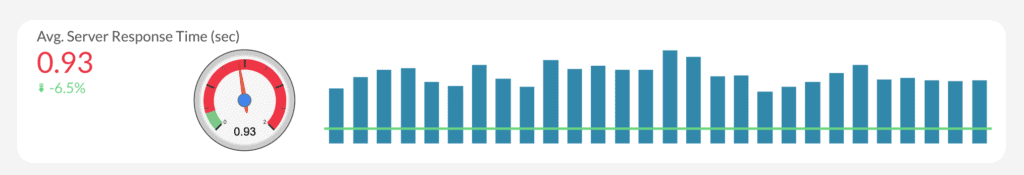
As its name says, this metric corresponds to the time your server takes to respond to a user action. Its optimal time threshold should be below 0.2 seconds. If your time is slower, you may check your hosting provider.
Avg. Server Connection Time
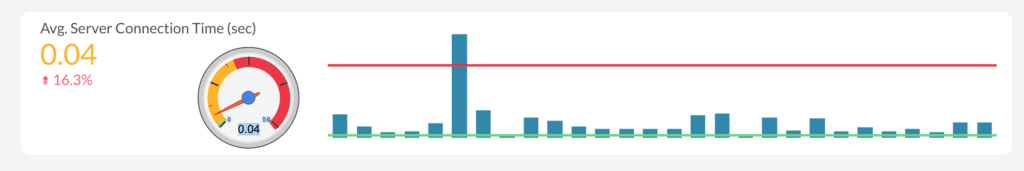
This element generally represents the shortest time during the entire load experience, along with the Avg. domain Lookup Time. It represents the time a server IP takes to connect with a user’s device address. The optimal time should be below 0.01 seconds and up to 0.25 seconds.
Avg. Domain Lookup Time
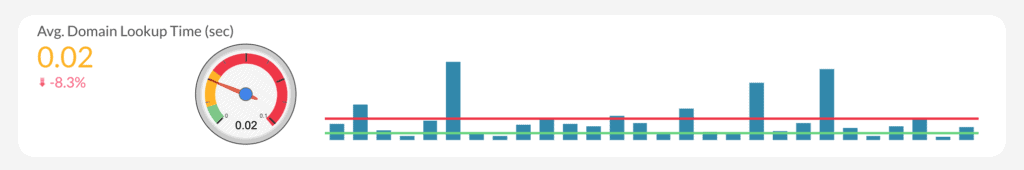
The domain lookup time happens before your page starts loading. It represents the time it takes for a user’s browser to connect with your domain IP. The optimal time should be below 0.01 and not above 0.03 seconds.
Avg. Redirection Time
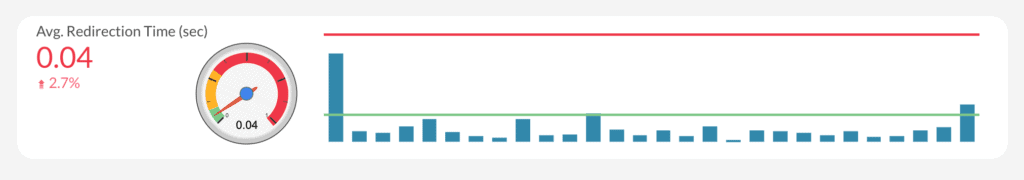
This metric represents the time it takes your site to perform a redirection if it has any. Here is where multiple redirections may affect your website time. Avg. redirection time should ideally take less than 0.03 seconds and up to 0.08 seconds.
Would you like to seed up your website?
I have personally loved IMGHaste. I’m buying it for my site, and I’m happy to pay for it.
In a few minutes, you can convert all your P NG and JPEG images to WEBP the image format Google encourages to use as its many time lighter than the standard formats. It also comes with a CDN to make sure your site loads fast anywhere in the world.