

To help you grow, we want to go beyond blogging – we want to give you the tools to make it happen.
This time, we wanted to create a free Google Data Studio report template to help you track your website’s content performance.
This report template is ideal for all website owners, startups, agencies, or companies of any kind that want to track their success with their content marketing efforts.
The best thing is that it is free to use – just make a copy, link it to your Google Analytics account, and you’re done.
Google Data Studio is a free Dashboarding tool from Google.
While you can connect virtually any data source, it comes with Google products connectors like Google Analytics, Google Ads, and Google Search Console.
To install this template, click on the copy Icon on the top-right corner, then, link your Google Analytics account. Read this guide to help you for further information.
How do you track your website’s content performance?
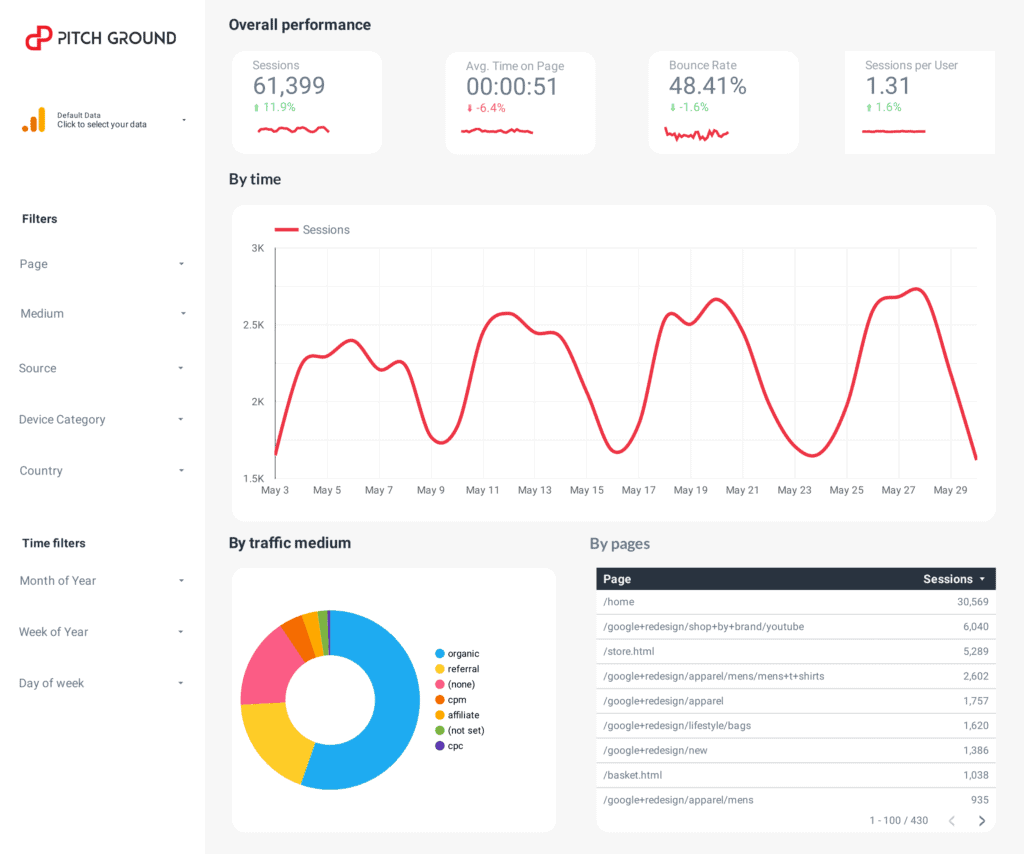
While Google Analytics offers hundreds of metrics to review, content performance—or simply knowing if people engage with your content and you’re growing your audience—require a specific set of metrics, such as:
Sessions: sessions correspond to the amount of visits people make to your site, being different from users, which is the amount of unique devices. If you visit a site from your PC on Friday and then on Sunday, those are two sessions and one user.
Average time on page: session duration is a function of how much people engage with your content. Generally, the more time, the more engaging your content is. This is not the case always, though: for documentation, for instance, you want people to not last more than a defined threshold of time because it may mean that they’re finding your content mandatory, but complex.
Bounce rate: Bounces are the percentage of sessions that end up in nothing. I mean, those sessions where people visit your content and they don¡t perform any action or event, like a click. It represents negative user experience; the higher the bounce rate, the more spammy or irrelevant the content is.
Returning visitors: recurrent visitors represent that there are people that liked your site so much that they’re coming back to see it again and again. Generally, such retention is associated positively.
Acquisition source: the source corresponds to the specific website visitors come from. If you do SEO, the source would be Google’s search engine; if you do social media, the source would be Facebook, Instagram, LinkedIn, and so on. If you’re cited in media, the source would be things like WSJ site. The source helps you identify which channels and efforts are paying off as traffic generators.
Top pages: besides knowing if people like your content, you should pay attention to which content people are paying most of the attention. As such, you may want to visualize all these metrics by pages to spot popularity and relevance.