If you want to deliver better user experience, monitoring your services—like apps, websites, or hosting—is the first low-hanging fruit to look at.
Service monitoring is a quick win because it tells you that when a customer has friction during his or her experience, it didn’t even start.
In this article, we will review why most businesses—if not all— should start monitoring 24/7 their services and how they can get started.
Why performance matters
Whether your site or service is slow or is not even available affects your conversion rates and engagement. The conversion rate represents the effectiveness of making users perform the desired action.
Engagement, while abstract, represents the ability of people of use your product.
Both have a significant impact on businesses in all fronts: current customers leaving, preventing potential customers from paying, and potential market avoiding your brand.
A few years back, Strangeloop tested the speed of 2,000 leading retailers’ websites, reaching up to 10 seconds to load.
Google also monitored mobile speed. The average time for a mobile page to fully load is 22 seconds.
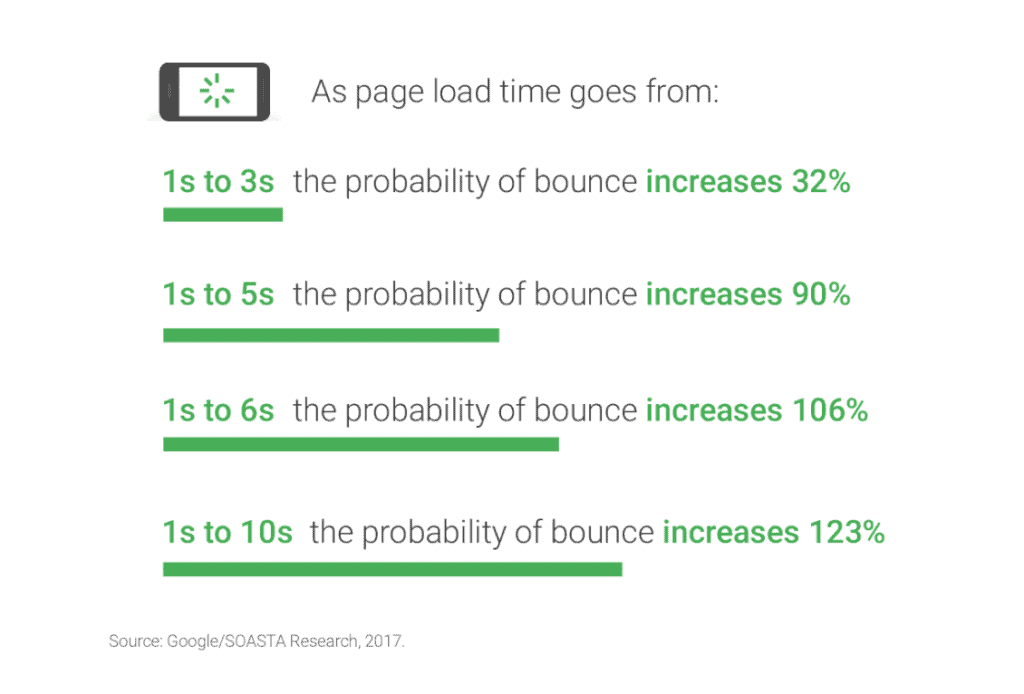
Common knowledge tells us that users tend to leave after 3 seconds of load time.
Every second counts when it comes to bounce rates.
How bad is a downtime in your company?
Once, I knew about a company being saved by a competitor.
Here’s the story.
I used to work in the Internet of Things industry. To simplify, IoT is about monitoring (and acting on) sensor data that you store and visualize on the cloud.
It seems abstract but has many use cases that explain all the hype around it. Just think of applications like:
- Nest, a smart home company acquired by Google for +2 billion Dollars.
- Cropx, a farm management automation company that deploys sensors in yields to monitor their conditions for smart irrigations.
- Or homemade brew monitoring apps that help beer enthusiasts (aka Germans) to know when their beer is ready, instead of manually checking every 6 hours.
IoT use cases are endless, and some of them critical.
Think of healthcare, where you want to track patients’ vitals and assets uptimes, just like checking that equipment is working or a hospital is not running low on oxygen.
It turns out that one of the well known IoT platform providers a few years back was serving hospitals. It quickly passed from a proof of concept to be a fundamental part of operations, even for the Intensive Care Units.
The company became so essential for hospitals that is simply couldn’t go down—but it did.
A downtime here doesn’t only mean lost business but putting lives in risks, and the IoT provider couldn’t keep their systems up.
It was such a desperate situation that one of their competitors quickly offered assistance by supplying them with the infrastructure and workforce to solve such unexpected intermission ASAP.
Why and when 24/7 monitoring matters?
Of course, our IoT nightmare is one of the most extreme scenarios you could face.
But, what about your website is down?
What about your app not working or presenting 500 errors?
Unless you’re a developer, chances are you manually check your services by merely refreshing and noticing everything is working fine.
You only worry about them and their performance when it is too late.
You’re late when customers churn due to bad customer experience. They’re hardly coming back, and they will share such a bad experience with others.
You’re late when your website bounce rate increases because people cannot even access your site properly.
You’re late when the IP where you’re hosting your website is blacklisted, affecting email deliverability.
And you can be sure manual checking is not enough, and a tool is necessary when you know no website can offer a 100% uptime.
What is a decent uptime then?
It depends on how critical is your service for customers and their willingness to pay to ensure those uptimes.
Like the IoT case we shared with you, some businesses offer a Service Level Agreement where companies may be willing to spend more to be guaranteed the highest uptime possible.
But, what would be the minimum for your business? Benchmarks start from 99% to 99,*n%. Chances are we ignore the importance of an additional digit, so this table explains it better:
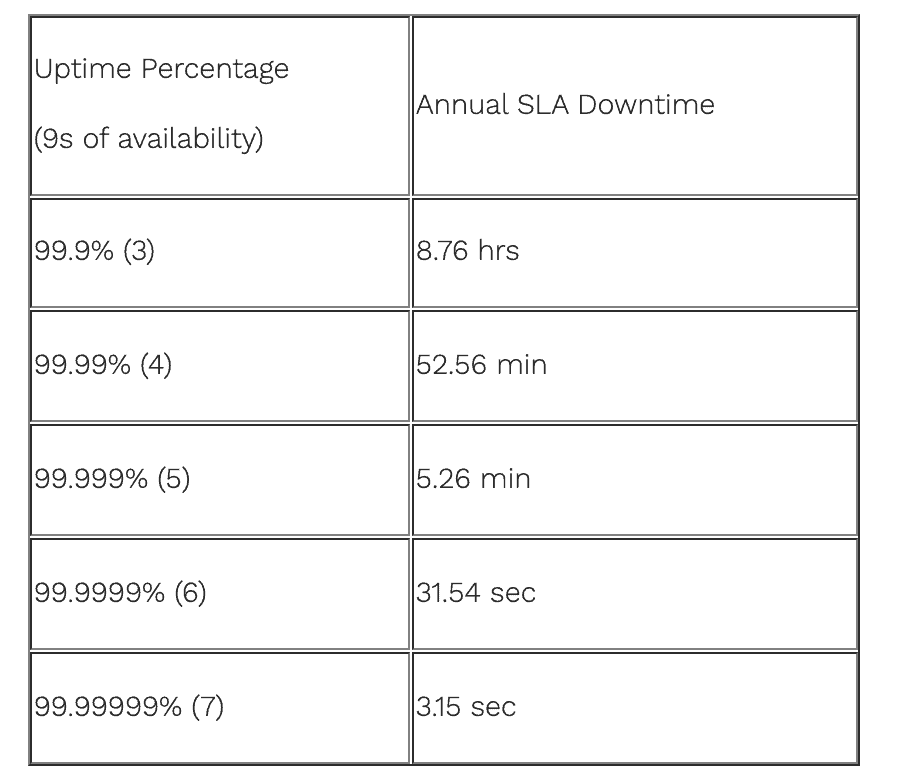
By the way, if you own a regular app or website, chances are your uptime is way lower than this. However, without monitoring, it is impossible to tell.
How to monitor your services right away: a few-minutes implementation
At Pitchground, we’re offering a lifetime deal of Uptime360, an all-in-one services monitoring tool that lets you:
- Track servers performance and availability
- Monitor any aspect of an application
- Site speed overtime
- IP blacklist tracking
- Public status pages
To get started, we’ll sign up. I always prefer to do it with Google.
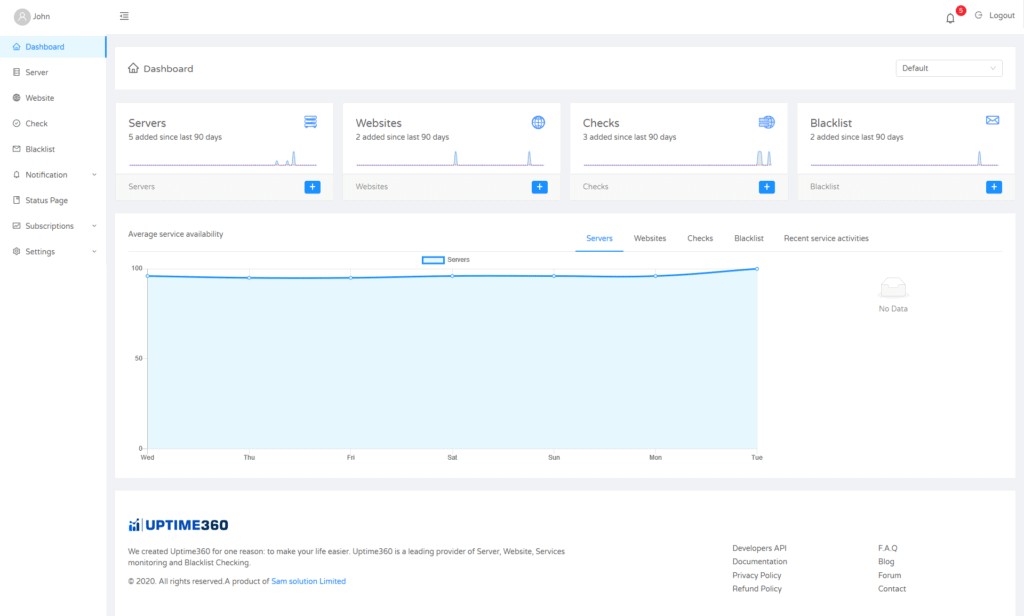
Now, we’re in the app.
The first view is the general dashboard that shows the average availability of all the services connected to my account, broken down in servers, sites, checks, and blacklists—which we will cover in detail soon.
Servers
Starting to monitor our services may take us a few minutes. Check it out.
We will go to “Servers” and “Add.”
I will give it a name to identify it on the app; I can choose to assign it to a project to group all our apps and specify the platform where it is running.
Once you click on “add new,” it will give you a command that you will run as root to install Uptime360 on your server.
Once we get the confirmation in the console, we will wait for one minute to start visualizing performance metrics.
You can monitor different aspects of your servers, like CPU, RAM, and Disks, to track their current usage and speed.
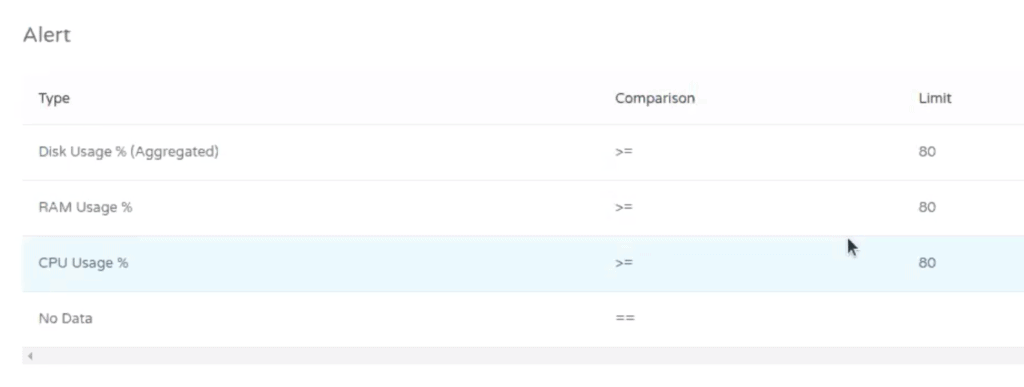
Alerts
Once we go to alerts, we can see that we can set notifications on dozens of uptime metrics, opening the door to many possibilities.
For instance, you can set up an alert when your CPU usage is over 80%, and you’re reaching a limit to prevent potential downtimes.
You may also choose the contacts you want to send such notifications to manage who gets what.
Websites
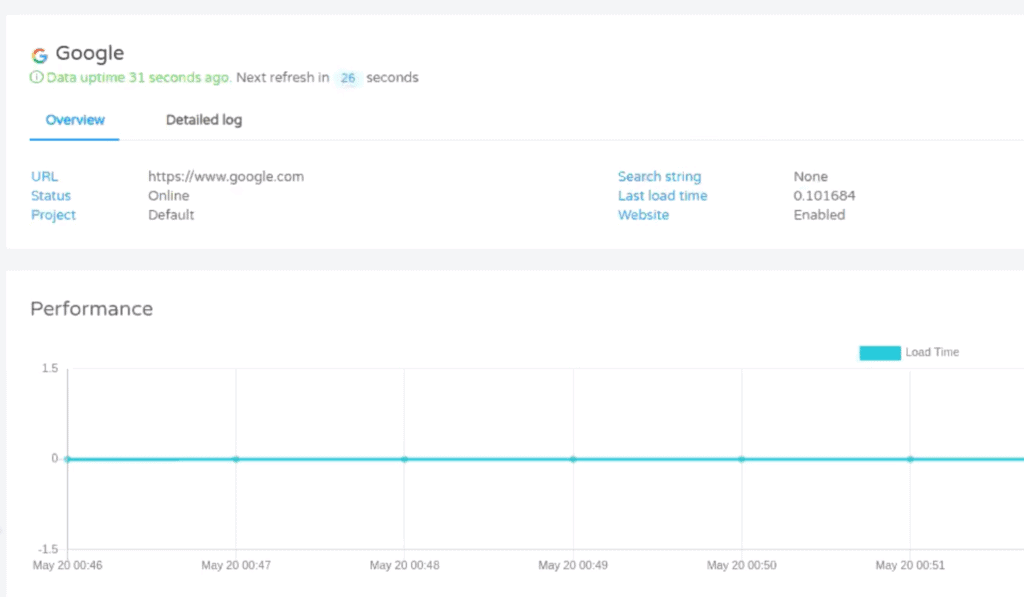
A less technical but critical use case is checking if your website is up always, which could help you quickly spot downtimes and slowdowns that are wiping out your traffic.
So, let’s go to the section of the site and add a new website.
You can give any name to your site to identify it on Uptime360.
Now add the URL you want to monitor.
And this “Search String” feature is pretty useful.
Any element on your site looks up like your Google Analytics, Tag Manager, or Facebook script to see if they’re fetched on your website.
Finally, we will set up the alerts to let Uptime360 when to notify an incident.
This time, we want a load time threshold of a maximum of 5 seconds.
If our site takes more than that to load entirely, we will count a new occurrence.
But we will only trigger an alert, if such an occurrence happens three times, to avoid notifications overload.
Once done, you will wait one minute to start visualizing website performance data.
Blacklists
With Uptime360, you can check if your IP address is blacklisted in over 200 providers.
Remember that being on a blacklist may hurt email deliverability, among other things.
You just need to copy and paste your IP address and Uptime360 will start scanning which internet Server Providers might have flagged you.
Status pages
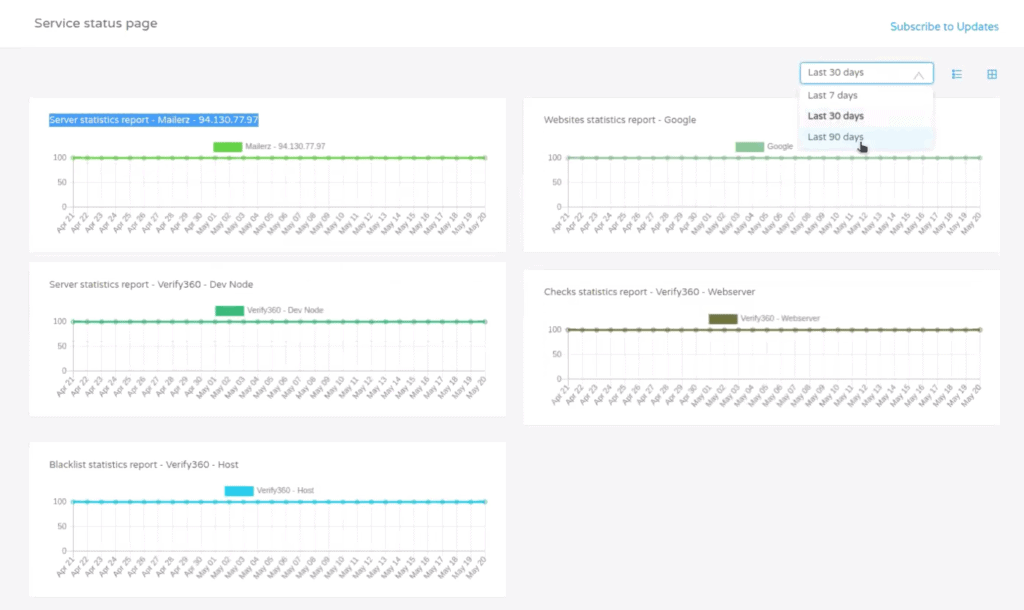
A great feature for end-users is status pages.
Status pages are public pages where you can publish these reports so anyone—like your customers—can check without signing up to Update 360.
Here’s how they work.
I’llI’ll click on “Status page” to create a new one.
We can customize the page look, such as logos, images, titles, and charts.
You can also personalize the services you want to share on each status page.
So, for instance, I will share the website and server I set up in this demo.
I can also display a message to notify incidents or updates to users. As an example, I can tell them we will have planned downtime on a specific date.
To finish, we will copy and paste the URL in the browser to access our status page and boom!
Here you have a friendly page other users can visit to monitor their services.
Oh, as you can see, users can also subscribe to receive an alert when you publish a new update.
Notifications
By the way, you may be wondering what kind of notifications Uptime360 can send.
So let’s go to the notifications sections and channels.
You will find out that we can trigger email, SMS with Twilio, Twitter alerts, and push notifications.
Want to grab this lifetime deal?
You already know how critical it is to have all your services up and running; you also know how to make it happen with Uptime360.